- The DTC Times
- Posts
- 🫨 Earthquakes & Faultlines
🫨 Earthquakes & Faultlines
Issue 9 - DTC on the stock market, growth quotient, and Meta performance
The DTC Times
April 6th, 2024

Earthquakes hit both Taiwan and New Jersey this week. We’re not sure if this is some kind of omen, but life continues to be tough in DTC-land.
High-growth darling brands of the ZIRP era continue to struggle. The frustrating Meta issues of Q1 still linger (or do they?). And Klaviyo is getting pretty expensive for their bigger clients.
But at least we dug up some great advice on how to grow profitably.
Public DTC companies faltering
Ben Cogan, co-founder of Hubble Contacts, made a post a year ago exposing public DTC brands’ poor performance on the stock market.
A couple of points:
Most stocks, tech especially, were down
NASDAQ was down 23%
The IPO index was down 62%
So stocks being down wasn’t an anomaly.
On the other hand, Ben estimates that DTC stocks on average were 80-85% lower than at their (recent) peaks, outpacing the tech stocks in a race to the bottom.
His report: DTC isn’t doing any better. In fact, they’re doing worse.
According to Ben, DTC stocks are, on average, 90 - 95% below their peak. Or about 10% worse than last year.
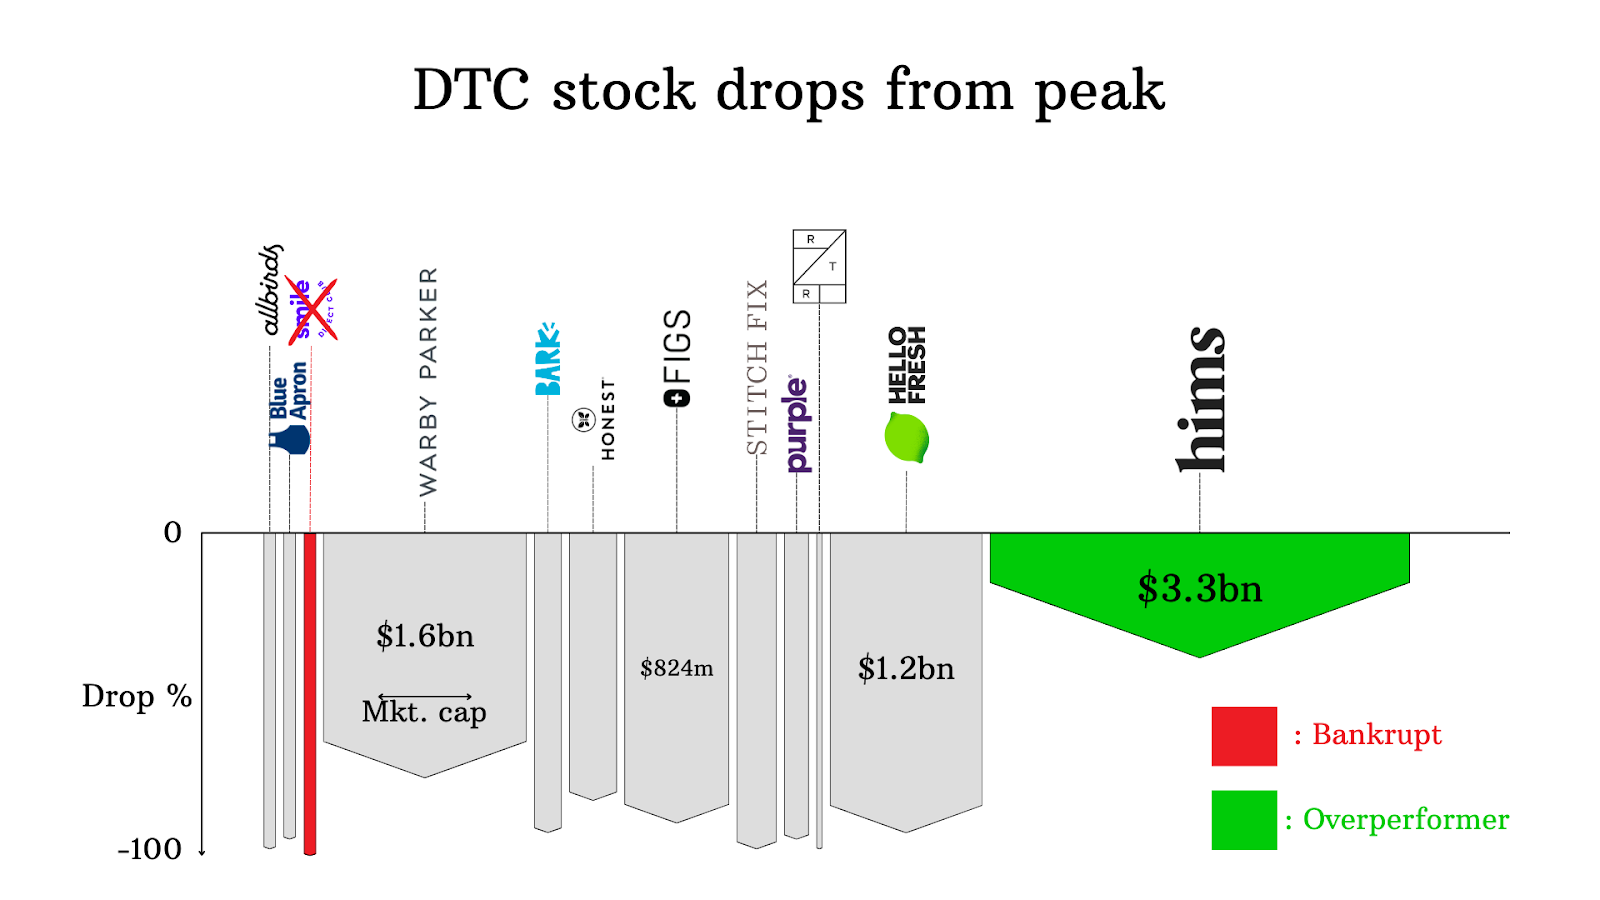
FIGS and HelloFresh are the only two that were profitable, and even then, only just. Most operated with -10% to -90% margins.
On the other hand, we have a positive outlier in Hims. While their stock value dropped 36% from peak, it is actually up 56% from the De-SPAC price. Their last 2 years have been stellar, with a 75% cut in losses and a 220% increase in revenue.
Their secret sauce? Sub-24 hour, personalized diagnoses and solutions for customers’ Sexual Health, Men's and Women's Dermatology, Mental Health, and Weight Loss. High demand, highly charged personal issues with an almost unlimited TAM (total addressable market).
They’re doing it right in the right market, what can we say? 🤷♀️
Meanwhile, as the DTC slump worsens, NASDAQ has recovered and is stronger than ever.
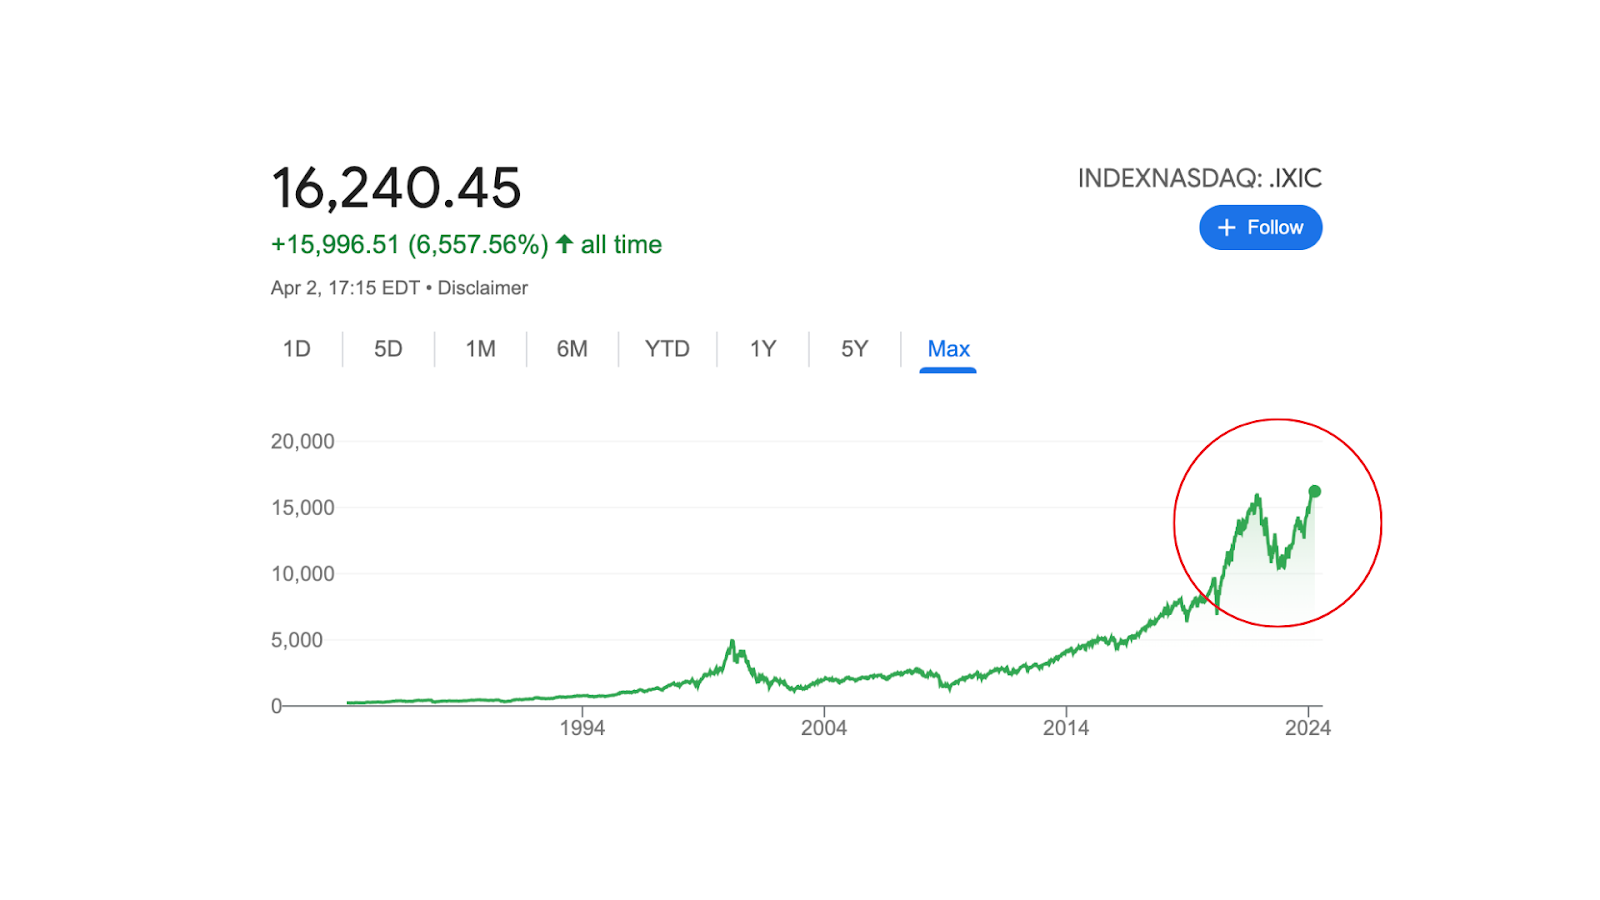
Which begs the question: why hasn’t DTC followed?
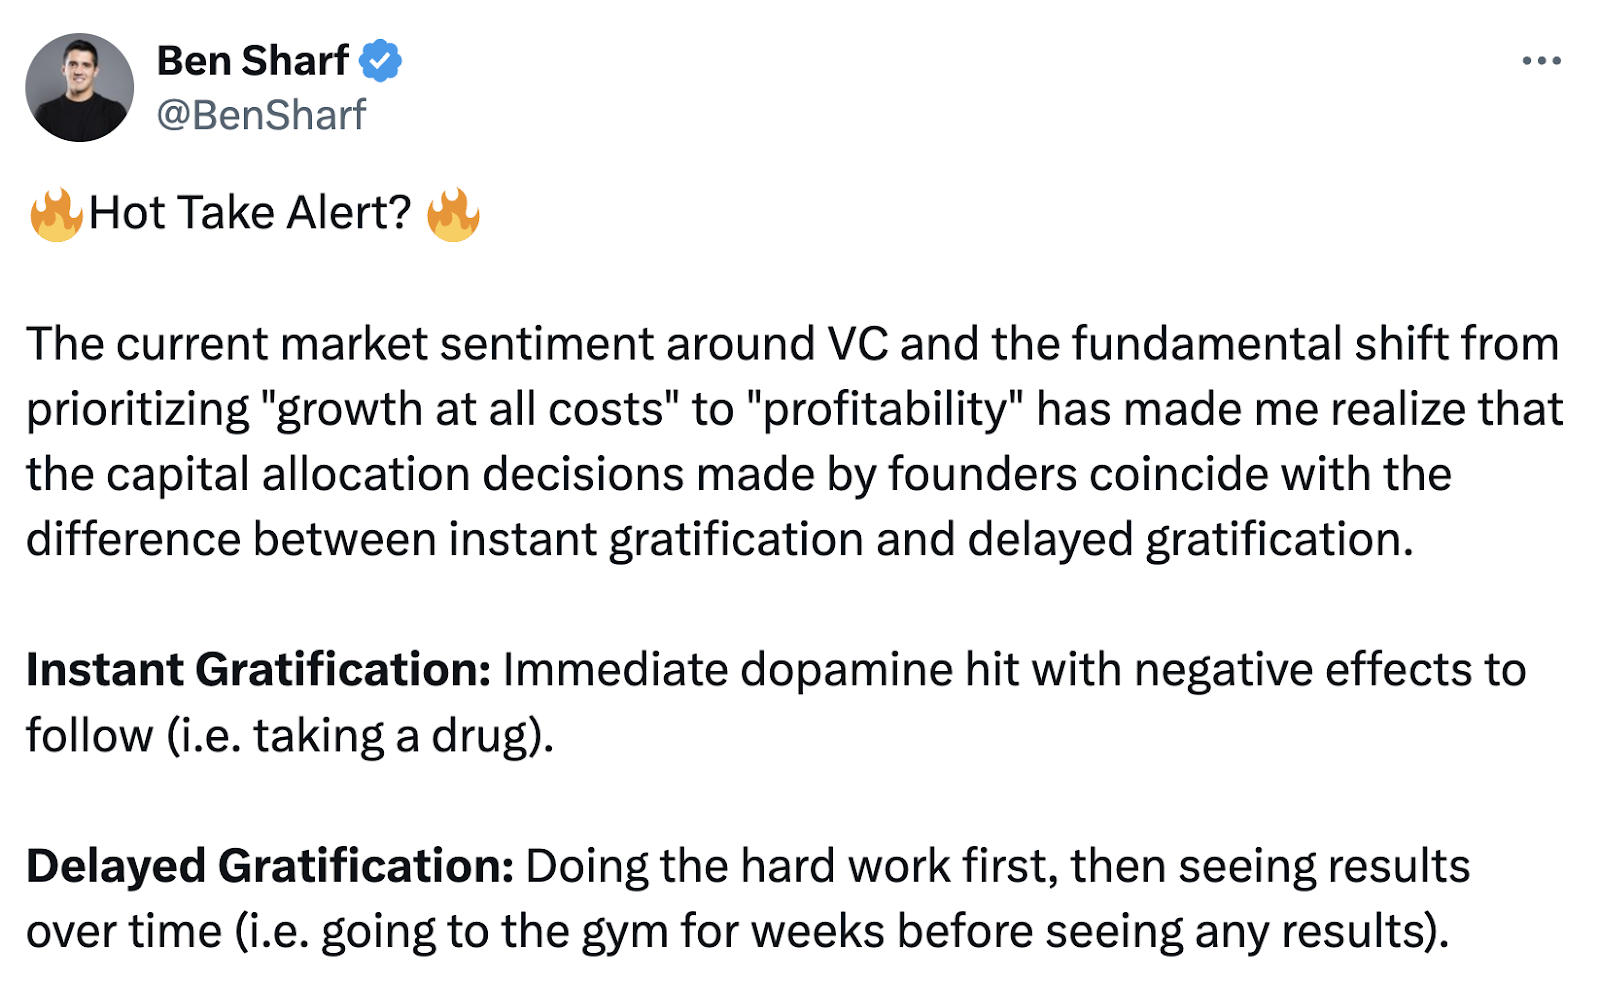
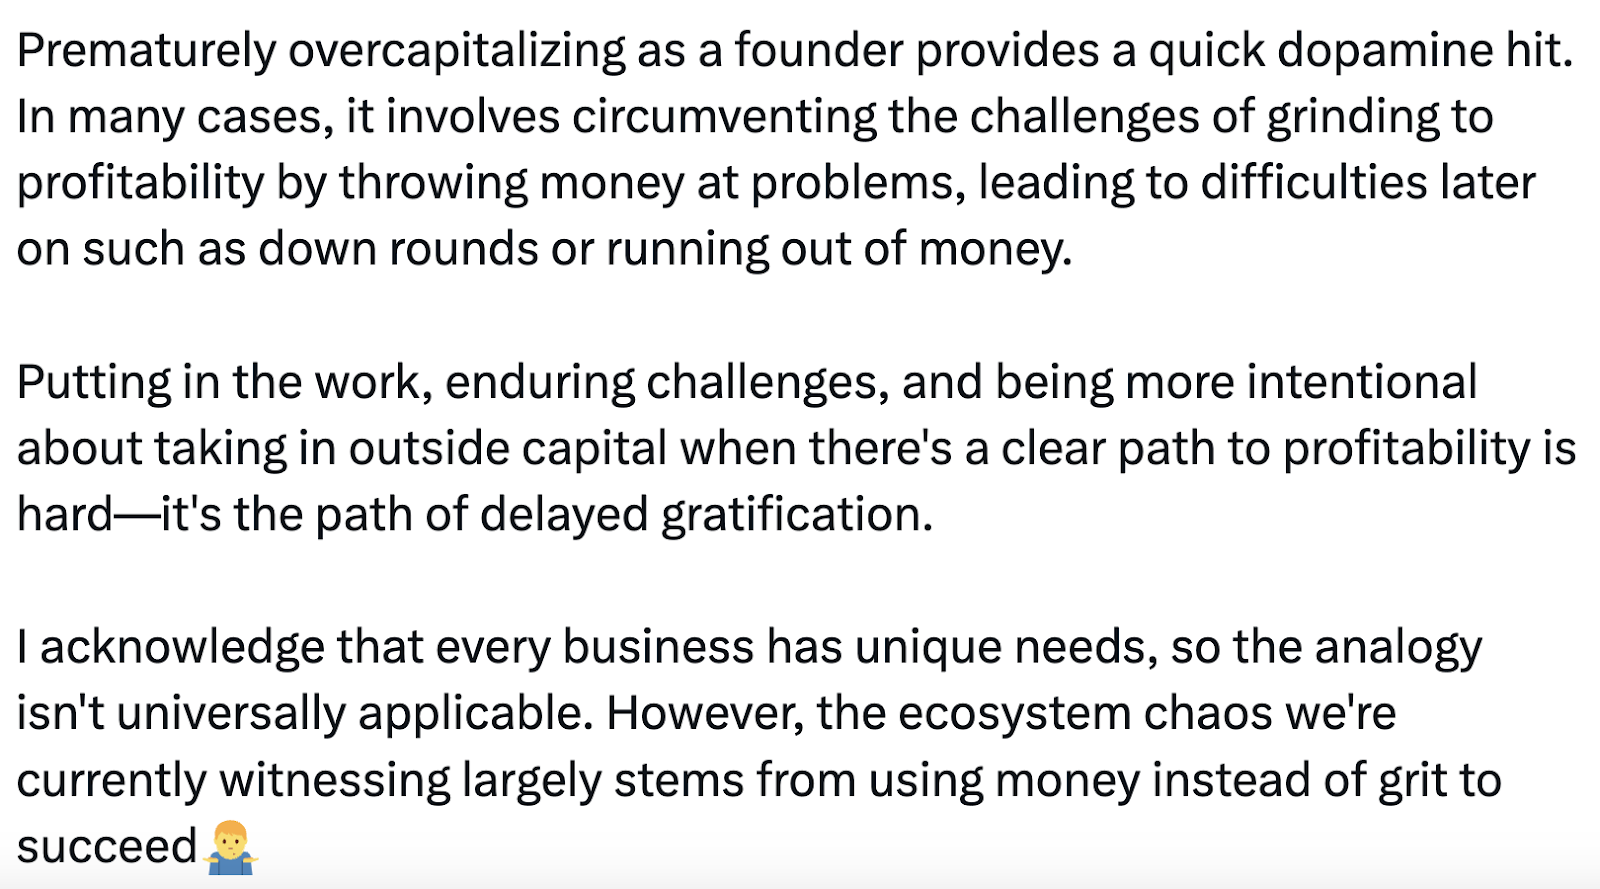
Well, if you’ve been in the space for a while, this will sound familiar: DTC brands aren’t profitable (for the most part). Since the pandemic and the end of the ZIRP era (see our newsletter “Headwinds and Tailwinds”), investors have switched from supporting long runways to a preference for immediate profitability.
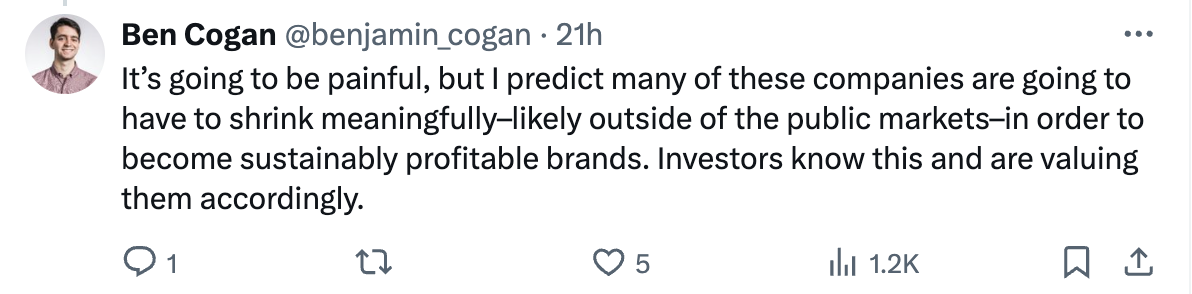
Putting growth first means some companies may actually be unsustainably large. Maintaining a larger-than-deserved market share means they’re burning cash in inefficient paid media. Accepting shrinkage and rebuilding lean may be more viable than fighting against the current.
Either way, DTC brands are faced with the following choice: attempt to redesign their business model and achieve profitability NOW (maybe even yesterday), or continue to lose trust.
Sticky situation.
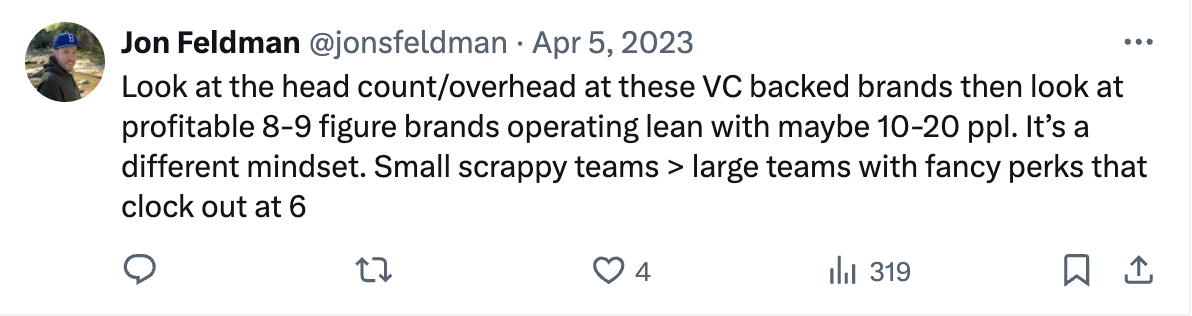
A year ago, Jon Feldman, founder of Prospect Print Co., had this to say in response to Ben:
Today, Ben agrees:
Find Your Growth Quotient
While you figure out the switch to profitability first, here’s some actionable stuff.
CEO and Director of Digital Product Strategy @ Common Thread Co. respectively, have developed a formula that serves as a diagnostic tool for an eComm. brand’s health: the Growth Quotient (GQ).
Using Bambu Earth (a brand they acquired) as a case study, they break down the GQ and how to use it. Bambu Earth's GQ score is 119.7, which is just shy of the "duckweed threshold" of 130, indicating brands that can grow in any environment.
Translated in growth terms, Bambu Earth grew about 50% to 70% between 2022-23. Duckweed companies are typically 100% and higher.
The Essence of the GQ
At its core, the GQ score is a holistic measure evaluating a brand's readiness for scalable growth, scrutinized through ten pivotal metrics:
Cost of Delivery: Minimize variable costs.
Operational Expenses: Streamline fixed costs.
Cash Conversion Cycle: Accelerate return on cash outflow.
60-Day Incremental Revenue Growth: Maximize short-term customer value growth.
First-Order Profitability: Achieve profitability on the first purchase.
Distribution Channels: Diversify revenue streams.
Percentage of Organic Traffic: Reduce reliance on paid ads.
One-Year LTV to CAC Ratio: Enhance customer lifetime value against acquisition cost.
Revenue Peaks: Utilize the calendar for maximum potential.
Customer Retention and Acquisition: Balance between nurturing existing customers and attracting new ones.
Each of these comes with benchmarks that indicate under or overperformance.

A quick look at Bambu Earth showed them they had a losing GQ score with only 35% of traffic coming from organic sources, whereas their benchmark is 50%. In Taylor’s words: “GQ perfectly nails our biggest liability: that we are leveraged on paid.”
Great, they know their weakness. Except they’re absolute Facebook ad wizards, essentially covering for this paid media reliance risk.
What’s important is they’re aware of it thanks to the GQ.
Takeaway: There is no one way to run a business, and you can reach a “duckweed” score while underperforming in some metrics. However, you need to be able to justify why you’re doing it your way. The first step toward doing that is knowing WHAT you’re doing. Using a diagnostic tool like the GQ is a great way to get there.
Meta’s Broken, Right?
Everyone knows you need to take what you read online with a grain of salt. But let’s be honest. We all slip. Even if you exercise critical thinking at all times, it's hard not to be swayed by your echo chamber.
When it comes to the Meta-being-broken talk, doing impartial research is necessary. Most of the buzz is on the broken side, while a few make strong, data-supported cases otherwise.
At first glance, it’s easy to see why most would claim it's broken. Most people aren’t on winning streaks. It’s an exceptional thing, which is why it’s lauded. Those making data-driven counter-arguments are using their own data which can easily be an outlier.
With these points in mind, you are equipped to enter the debate and judge for yourself.
Yoshi.
—
A bit of background:
Meta caused excessive spend on two notable occasions in the past months.
First, on February 14th.
Then, on March 21st, which prompted an apology statement:
"On March 21, 2024 at 4:36 pm PDT we experienced an issue that resulted in excessive spend and delivery for some campaigns, due to a problem with our conversion prediction models. The impact was more concentrated on Instagram, and in campaigns using bid/cost controls. The issue was mitigated in 2.5 hours.
We are continuing to investigate the overall impact of this issue, in order to determine any individual eligibility for refunds. We will share more when available.We know how frustrating it is when our tools don’t behave as expected. We sincerely apologize for any inconvenience this may have caused, and appreciate your understanding and patience."
The question is: are there just acute errors, or is Meta underperforming in a broader, more regular sense?
First piece of evidence: Shopify is not at fault (@Yardenshaked).
Jonathan Snow’s take was in the form of question: “What are you comparing to? Just last month? Or the same month last year?”
Using his own tool that displays:
1. MTD vs Prior Month
2. MTD vs Prior Year
3. YTD vs Prior Year
He actually found an improvement in performance when comparing this quarter (Jan - March) to the same period last year.
However, if he went MoM, i.e. March vs. February, there was indeed a drop in performance. Here’s the thing: his business actually saw an unusual spike in performance in February.
His observation: brands are spiking at different times so it's important to take a broader, YoY view.
In a subsequent post, Jonathan Snow made a data-supported claim that Meta’s poor performance could be an attribution issue on Meta’s side.
To which Cody replies:
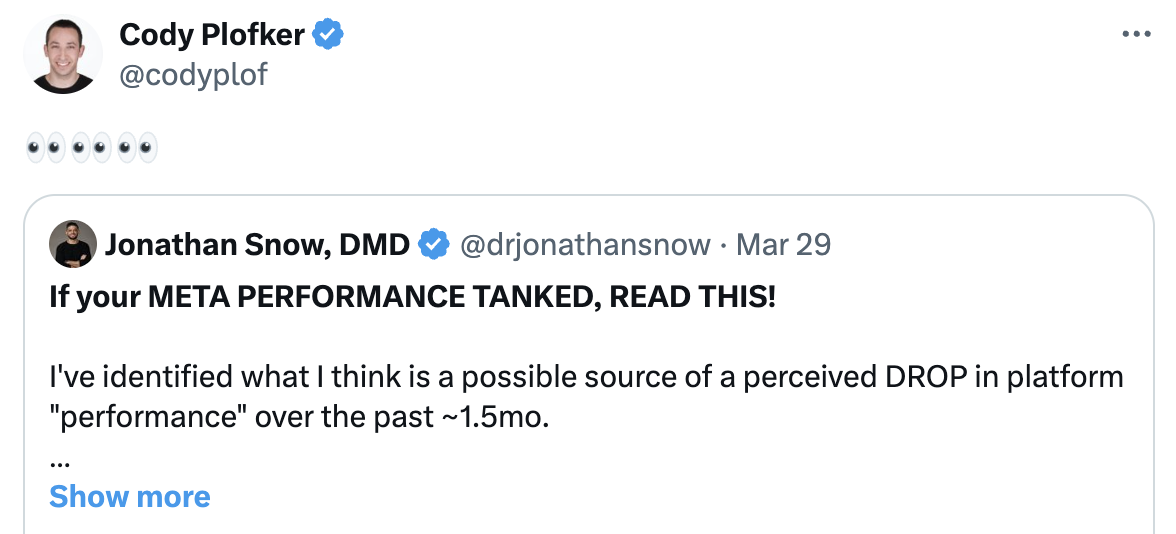
Only to post this a day later:
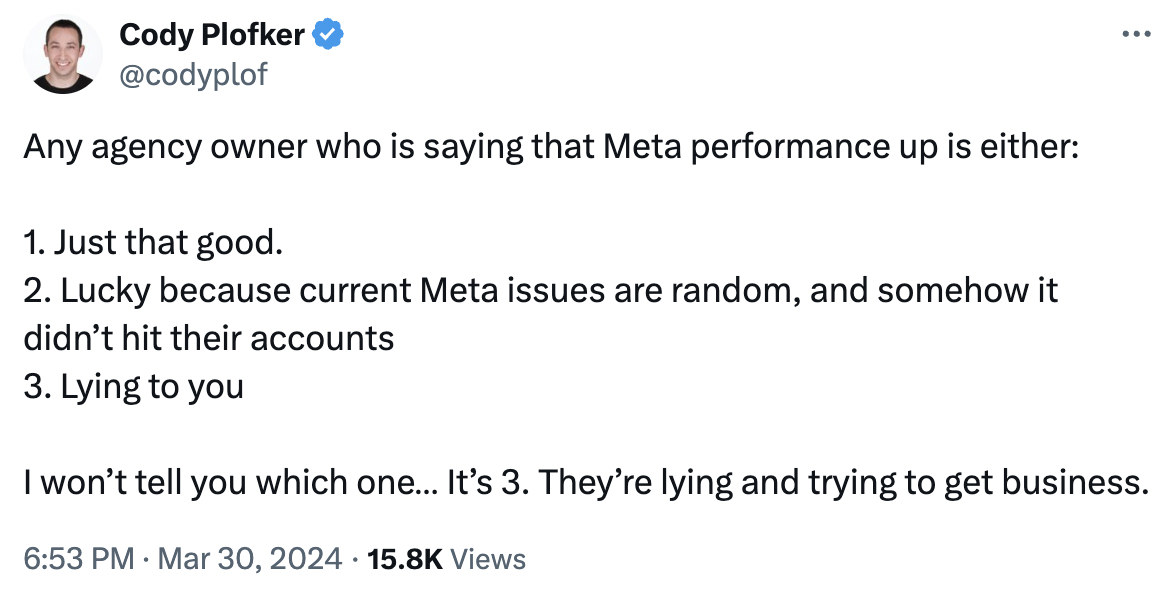
🤷We gotta get you in on the drama, too.
The (DTC) world needed answers. Yarden Shaked, CEO & founder at Varos.com, used the 6k advertisers on his platform to find some. Conclusion? 👇
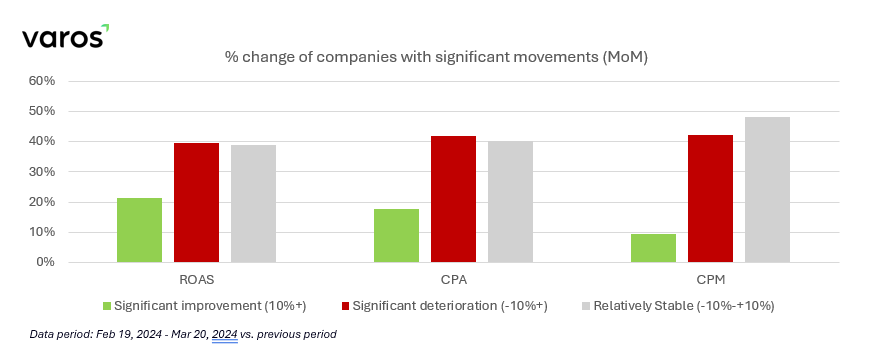
In red, those with at least 10% worse performance. Grey, stable. Green, improvement.
On average, things did get worse.
Dave Rekuc replied:
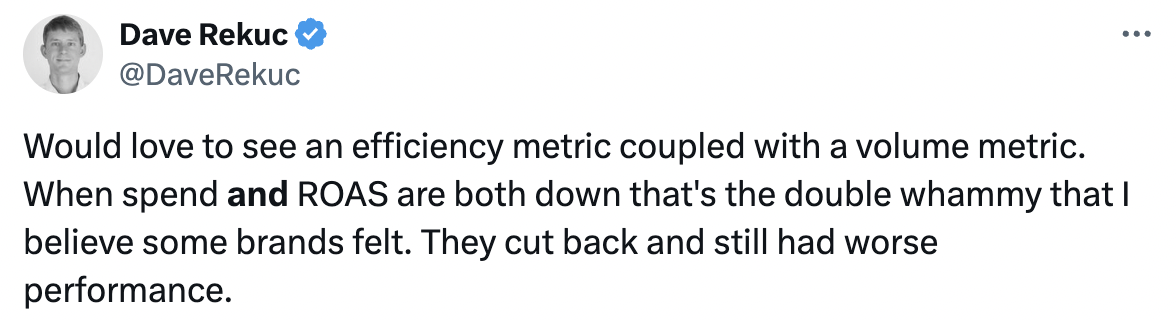
Reminding us that data doesn’t always paint the full picture. Yarden got us closer here, but there is more to it.
All of a sudden, Mandar Shinde, who helped Jonathan Snow reach the conclusion that Meta’s attribution might be the problem, said this:
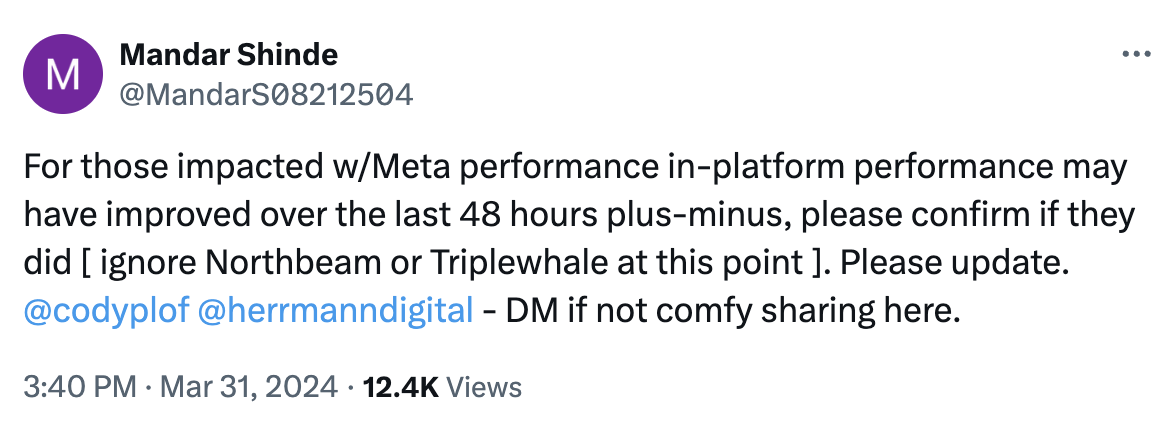
Replies were, on average: “Yep, they’re better. But could be a blip.”
5 days later…
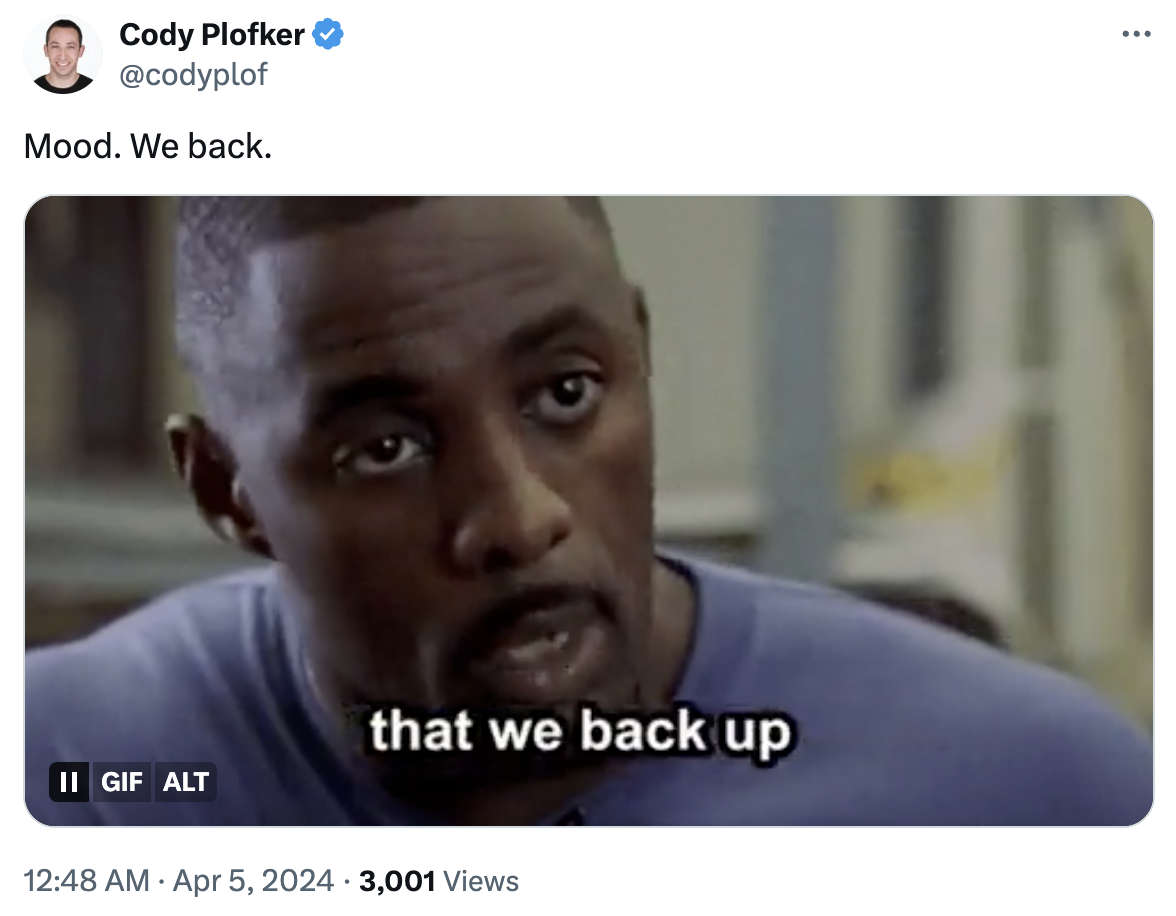
What happened, exactly? We’re not sure, but Cody thinks we shouldn’t jinx it. Meta ads are “working” again.
Takeaway: Meta HAS sucked for some. It also hasn’t for big players looking at data YoY. It’s also better all of a sudden. Maybe. Regardless, we’re still not sure if anyone really knows what’s going on since the outages and difficulties have not been universal. Keep you eyes on your numbers, stay open to individual reports, and be wary of absolutes.
Quick Hits
Klaviyo enforced their Active Profiles limit where they will be charging people for having contact lists that are too large. Many agencies and their clients will see their bills skyrocket unless some major cleaning is done.
RC Williams, a long-term Klaviyo customer, wrote them a strongly-worded message when he saw his bill would go from $375/month to $1,495/month. Their response? Vague words seeming to indicate this new rule was only for accounts created after April 2nd. Except they sent this notification to everyone. Confusing.
Ever hear about the ”Sold-out” effect? It says that customers are likelier to buy what’s left when they see sold-out items on display. As long as you keep them between 10% and 30% of all items shown.
10 Ecommerce Landing Page Templates & 100+ Examples from the Best DTC Brands. All free, courtesy of Aaron Orendorff. In his own words: “Here’s the best, most-ridiculously-stack, should-not-be-free resource ever created on ECommerce landing pages”
Reply